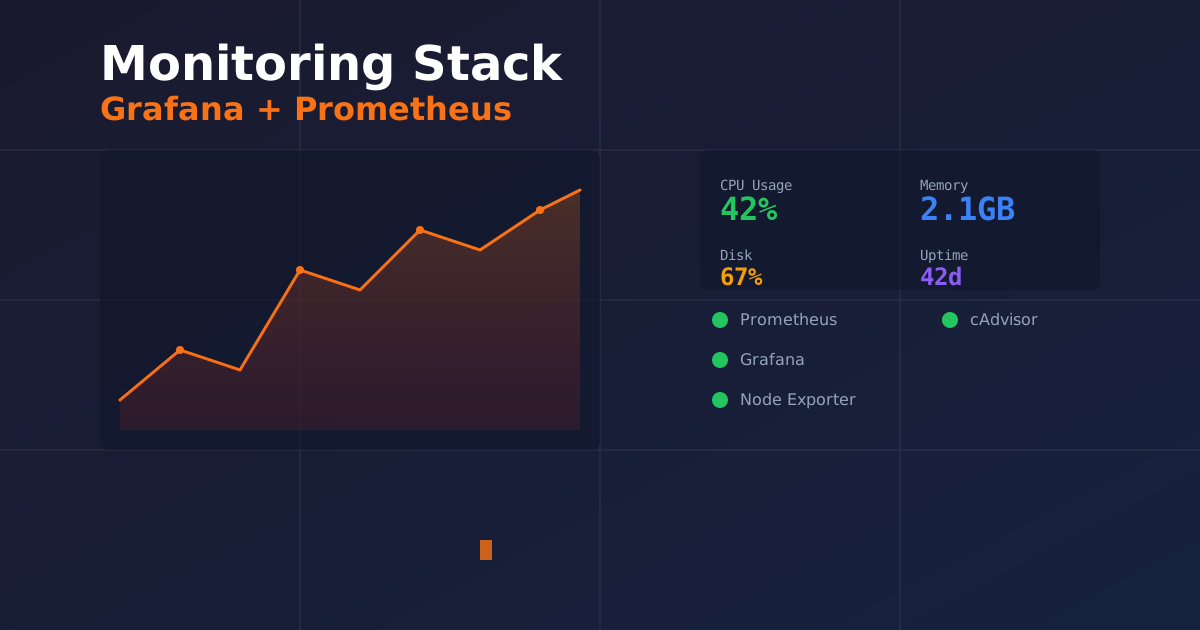
Self-Host Your Monitoring Stack: Grafana + Prometheus Setup
Learn how to set up a complete monitoring stack with Grafana and Prometheus on your VPS. Real experience, no BS.
import AffiliateLink from ’../../components/AffiliateLink.astro’;
The Problem I Had (And You Probably Have Too)
You know that feeling when your server goes down and you only find out because someone DMs you “hey, your site’s dead”? Yeah. Been there.
For months, I was running my self-hosted apps completely blind. No metrics, no alerts, just crossing my fingers and hoping nothing broke. When my Nextcloud instance randomly crashed at 2am, I didn’t know until I woke up. Not great.
I needed monitoring. But most solutions either cost money (Datadog, New Relic) or were way too complicated for a simple homelab setup. That’s when I discovered the Grafana + Prometheus combo.
Spoiler: It’s exactly what I needed, and it’s been running flawlessly for over a year now.
Why Grafana + Prometheus?
I looked at a bunch of monitoring stacks before landing on this one. Here’s why I stuck with it:
Prometheus handles the metrics collection. It scrapes data from your services (CPU, RAM, disk, custom metrics) and stores it efficiently. It’s designed for reliability—you can lose days of data and it won’t break.
Grafana makes that data beautiful. Dashboards, graphs, alerts—it’s the UI that makes sense of Prometheus’s raw data.
Together? Chef’s kiss. Open-source, battle-tested, and perfect for self-hosters who don’t want enterprise complexity.
The alternative I considered was InfluxDB + Telegraf, which is also solid. But honestly, Prometheus has better community support and more pre-built exporters for random services. If you’re monitoring Docker containers, Kubernetes, or web services, Prometheus is the obvious choice.
What You’ll Need
Before we start, here’s what I’m assuming you have:
- A VPS or home server running Linux (I use Ubuntu 22.04, but Debian works too)
- Docker and Docker Compose installed
- Basic terminal skills (you know what
cdandnanodo) - At least 2GB RAM and 20GB disk space
If you don’t have a VPS yet, grab one from Hetzner or DigitalOcean. For monitoring a handful of services, their $6/month boxes are plenty. Fair warning: if you’re monitoring 50+ containers, bump that up to 4GB RAM.
I run mine on a Hetzner CPX21 (2 vCPU, 4GB RAM) and it handles 15 services without breaking a sweat.
Step 1: Setting Up Prometheus
First, let’s get Prometheus running. Create a project folder:
mkdir -p ~/monitoring-stack && cd ~/monitoring-stackCreate a prometheus.yml config file. This tells Prometheus what to scrape:
# prometheus.yml
global:
  scrape_interval: 15s
  evaluation_interval: 15s

scrape_configs:
  - job_name: 'prometheus'
    static_configs:
      - targets: ['localhost:9090']

  - job_name: 'node-exporter'
    static_configs:
      - targets: ['node-exporter:9100']

  - job_name: 'cadvisor'
    static_configs:
      - targets: ['cadvisor:8080']
This config does three things:
- Monitors Prometheus itself (meta, I know)
- Monitors your server’s hardware via Node Exporter
- Monitors your Docker containers via cAdvisor
Now create the docker-compose.yml:
version: '3.8'

services:
  prometheus:
    image: prom/prometheus:latest
    container_name: prometheus
    volumes:
      - ./prometheus.yml:/etc/prometheus/prometheus.yml
      - prometheus-data:/prometheus
    command:
      - '--config.file=/etc/prometheus/prometheus.yml'
      - '--storage.tsdb.path=/prometheus'
      - '--storage.tsdb.retention.time=30d'
    ports:
      - "9090:9090"
    restart: unless-stopped
    networks:
      - monitoring

  node-exporter:
    image: prom/node-exporter:latest
    container_name: node-exporter
    command:
      - '--path.rootfs=/host'
    volumes:
      - '/:/host:ro,rslave'
    ports:
      - "9100:9100"
    restart: unless-stopped
    networks:
      - monitoring

  cadvisor:
    image: gcr.io/cadvisor/cadvisor:latest
    container_name: cadvisor
    volumes:
      - /:/rootfs:ro
      - /var/run:/var/run:ro
      - /sys:/sys:ro
      - /var/lib/docker/:/var/lib/docker:ro
    ports:
      - "8080:8080"
    restart: unless-stopped
    networks:
      - monitoring

volumes:
  prometheus-data:

networks:
  monitoring:
    driver: bridge
Spin it up:
docker compose up -dCheck if it’s working by visiting http://your-vps-ip:9090. You should see the Prometheus UI. If it’s not loading, check the logs:
docker logs prometheusPro tip: Prometheus keeps 30 days of data by default (see --storage.tsdb.retention.time=30d). If you’re low on disk space, drop that to 15d.
Step 2: Setting Up Grafana
Prometheus is collecting metrics, but the UI is… functional at best. Time to bring in Grafana.
Add this to your docker-compose.yml (inside the services: block):
  grafana:
    image: grafana/grafana:latest
    container_name: grafana
    environment:
      - GF_SECURITY_ADMIN_USER=admin
      - GF_SECURITY_ADMIN_PASSWORD=changeme
      - GF_USERS_ALLOW_SIGN_UP=false
    volumes:
      - grafana-data:/var/lib/grafana
    ports:
      - "3000:3000"
    restart: unless-stopped
    networks:
      - monitoring
    depends_on:
      - prometheus
And add grafana-data: under the volumes: section at the bottom.
Restart the stack:
docker compose up -dNow visit http://your-vps-ip:3000. Log in with:
- Username:
admin - Password:
changeme
Change that password immediately. Seriously. I’ve seen bots brute-force default Grafana logins in under an hour.
Step 3: Connecting Grafana to Prometheus
Once you’re logged into Grafana:
- Go to Configuration (gear icon) → Data Sources
- Click Add data source
- Select Prometheus
- Set the URL to
http://prometheus:9090 - Click Save & Test
If it says “Data source is working”, you’re golden.
Step 4: Importing Dashboards
Grafana’s real power is in its dashboards. You could build one from scratch, but why? The community has already done the work.
Here are my go-to dashboards:
Node Exporter Full (Dashboard ID: 1860)
- Shows CPU, RAM, disk, network for your server
- This is the one I check every morning
Docker Container & Host Metrics (Dashboard ID: 179)
- Shows per-container resource usage
- Helped me catch a container memory leak once
To import:
- Click + (left sidebar) → Import
- Enter the Dashboard ID (e.g.,
1860) - Click Load
- Select your Prometheus data source
- Click Import
Boom. You now have beautiful graphs.
Step 5: Setting Up Alerts
Dashboards are cool, but alerts are what save your ass at 3am.
In Grafana, you can set up alert rules. Here’s an example: alert me if disk usage goes above 80%.
- Open the Node Exporter Full dashboard
- Click on the Disk Used % panel
- Click Edit
- Go to the Alert tab
- Click Create Alert
Set the condition:
WHEN last() OF query(A, 5m, now) IS ABOVE 80
Add a notification channel:
- Go to Alerting → Notification channels
- Add your email, Discord webhook, or Slack
I use Discord webhooks. When my disk fills up, I get a ping instantly.
One time, my Nextcloud logs ballooned to 15GB overnight. The alert woke me up before the disk filled completely. Worth the 10 minutes of setup.
What I Learned the Hard Way
1. Prometheus eats disk space if you’re not careful
I started with a 10GB VPS and Prometheus filled it in a week. Turns out, scraping every 5 seconds is overkill. Stick with 15s intervals unless you’re monitoring production infrastructure.
2. cAdvisor can be a CPU hog
If you’re running 50+ containers, cAdvisor might spike your CPU. I had to limit it to specific containers using --docker_only in the command args. For a normal homelab, you’ll be fine.
3. Grafana’s default dashboards are ugly
The community dashboards (like 1860) are way better. Don’t waste time building your own unless you have specific needs.
4. Alerts need tuning
I set my first alert to trigger if CPU > 50%. Big mistake. I got pinged every time I ran a Docker build. Now I use thresholds like:
- CPU > 80% for 5 minutes
- RAM > 90% for 3 minutes
- Disk > 85%
Trial and error, my friend.
Monitoring More Services
Once you have the basics running, you can add exporters for specific services:
- Nginx: Use the nginx-prometheus-exporter
- PostgreSQL: Use postgres_exporter
- Traefik: Built-in Prometheus metrics (just enable them)
- Uptime Kuma: Exports metrics natively
Each exporter is just another Docker container. Add it to your docker-compose.yml, point Prometheus at it, and you’re done.
I monitor Nginx, PostgreSQL, and my Traefik reverse proxy. It’s satisfying to see everything in one place.
Securing Your Monitoring Stack
Exposing Grafana on port 3000 to the internet is a bad idea. Trust me — bots scan for this constantly.
Here’s what I do:
- Put everything behind a reverse proxy (Traefik or Nginx Proxy Manager) with HTTPS
- Set up authentication — Grafana has built-in auth, enable it
- Use a VPN for administrative access to your monitoring dashboards
If you take away one thing: never expose Prometheus or cAdvisor ports directly. They have no authentication. A reverse proxy with basic auth or a VPN is mandatory.
Is This Overkill for a Homelab?
Honestly? Maybe.
If you’re running 2-3 services and don’t care about uptime, you can skip this. But if you’re like me and your self-hosted setup is actually important (I run my blog, Nextcloud, and email on my VPS), then monitoring is non-negotiable.
The peace of mind is worth it. I sleep better knowing I’ll get alerted if something breaks.
Next Steps
You now have a monitoring stack. Here’s what to do next:
- Secure your Grafana instance with a reverse proxy (Nginx Proxy Manager or Traefik). Don’t leave port 3000 exposed to the internet.
- Set up a few key alerts (disk, CPU, RAM). Start small and expand.
- Explore other exporters for services you care about.
If you want to take it further, check out Loki (Grafana’s log aggregation tool). It’s like Prometheus but for logs. I use it to grep through my Docker logs without SSHing into my server.
FAQ
Q: Can I run this on a Raspberry Pi?
Yes, but swap out some images for ARM-compatible versions. Prometheus and Grafana both support ARM64. Node Exporter works fine. cAdvisor can be flaky—test it first.
Q: How much RAM does this need?
For a basic setup (Prometheus + Grafana + Node Exporter + cAdvisor), expect 500MB-1GB RAM usage. If you’re scraping 20+ targets, bump that to 2GB.
Q: Does this work with Kubernetes?
Absolutely. Prometheus was built for Kubernetes. But if you’re asking this question, you probably don’t need this tutorial—go read the official Prometheus Operator docs.
Q: Can I monitor multiple servers?
Yep. Just add more targets to your prometheus.yml. Each server needs Node Exporter running, then point Prometheus at their IPs.
Q: What if I want to monitor uptime (like ping checks)?
Use Blackbox Exporter. It can do HTTP checks, DNS checks, ICMP pings, etc. I use it to monitor my blog’s uptime.
Q: Why not just use Uptime Kuma?
Uptime Kuma is great for simple uptime checks. But it doesn’t give you deep metrics (CPU, RAM, disk). If you want both, run Uptime Kuma and this stack. I do.
Final Thoughts
A year ago, I was flying blind. Now I have graphs, alerts, and actual visibility into my infrastructure. It took me a weekend to set up, and it’s been running without issues since.
If you’re serious about self-hosting, monitoring isn’t optional. It’s the difference between “my server’s down” and “my server’s down and I know why”.
Go set it up. Your future self will thank you.
Related Articles:
- Best VPS Providers for Self-Hosting 2026
- Secure Your VPS: Essential Hardening Guide
- Traefik Reverse Proxy Docker Setup Guide
Written from my homelab, running on a Hetzner CPX21, monitoring 15 services with zero downtime in 6 months.
Stay in the loop 📬
Get self-hosting tutorials, tool reviews, and infrastructure tips delivered to your inbox. No spam, unsubscribe anytime.
Join 0 self-hosters. Free forever.